
Ford Flex Insurance Rates
Enter your zip code below to view companies that have cheap auto insurance rates.
UPDATED: Jun 6, 2023
It’s all about you. We want to help you make the right coverage choices.
Advertiser Disclosure: We strive to help you make confident car insurance decisions. Comparison shopping should be easy. We are not affiliated with any one car insurance provider and cannot guarantee quotes from any single provider.
Our insurance industry partnerships don’t influence our content. Our opinions are our own. To compare quotes from many different companies please enter your ZIP code on this page to use the free quote tool. The more quotes you compare, the more chances to save.
Editorial Guidelines: We are a free online resource for anyone interested in learning more about auto insurance. Our goal is to be an objective, third-party resource for everything auto insurance related. We update our site regularly, and all content is reviewed by auto insurance experts.
How much is a Ford Flex to insure in comparison to other vehicles? Average Ford Flex insurance rates are $1,464 a year, or $122 a month. To learn more about Ford Flex car insurance rates and how to save on Ford Flex costs, read on.
Use our free rate comparison tool above to find out which insurance company has the cheapest rates for a Ford Flex.
U.S. average insurance rates for a Ford Flex are $1,366 a year for full coverage. Comprehensive insurance costs around $282 a year, collision costs $474, and liability coverage costs around $452. A policy with just liability insurance costs as low as $504 a year, with coverage for high-risk drivers costing $2,952 or more. 16-year-old drivers pay the highest rates at $5,160 a year or more.
Average premium for full coverage: $1,366
Price estimates for individual coverage:
Price estimates include $500 deductibles, minimum liability limits, and includes UM/UIM and medical coverage. Estimates are averaged for all states and Flex trim levels.
Price Range from Low to High
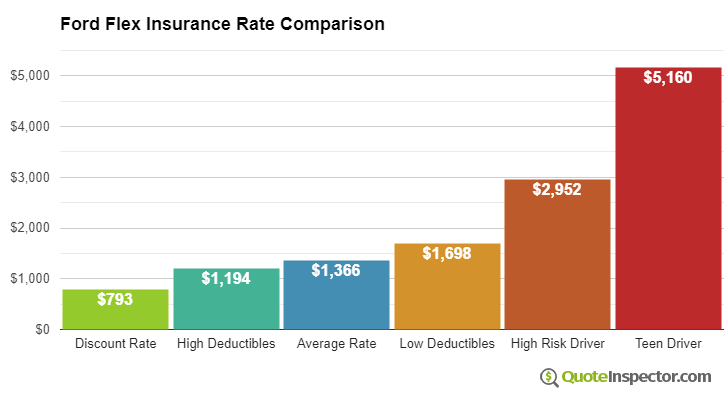
Using a 40-year-old driver as an example, Ford Flex insurance prices go from the low end price of $504 for a discount liability-only rate to a high of $2,952 for high-risk insurance.
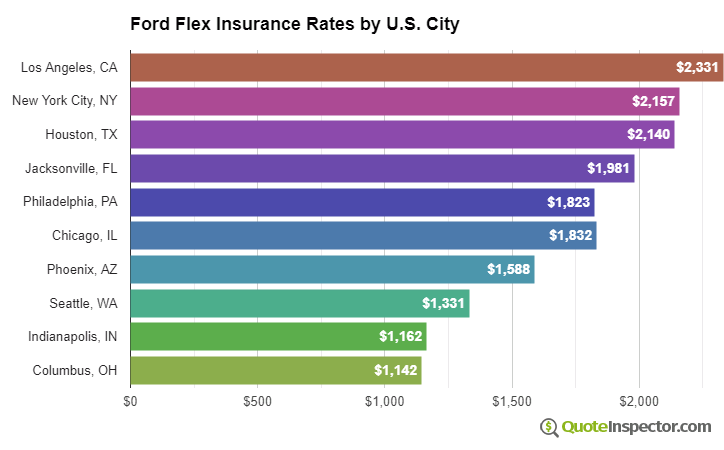
Geographic Price Range
Where you live has a large influence on auto insurance rates. Areas with sparse population have lower incidents of accident claims than congested cities.
The diagram below illustrates how rural and urban location affects auto insurance rates.
The ranges above show why it is important to compare prices for a specific zip code, rather than using rate averages.
Use the form below to get customized rates for your location.
Enter your zip code below to view companies based on your location that have cheap auto insurance rates.
Rates by State, City, and Model
The chart below shows estimated Ford Flex insurance rates for additional coverage choices and driver risks.
- The best full coverage rate is $793
- Using higher $1,000 deductibles will save about $1,194 a year
- The estimated price for the average middle-age driver using $500 deductibles is $1,366
- Buying low $100 deductibles for physical damage coverage will cost an additional $332 each year
- Higher-risk drivers with multiple tickets or accidents could pay at least $2,952 or more
- The price that insures a teenage driver can be $5,160 or more
Insurance prices for a Ford Flex are also quite variable based on the trim level of your Flex, how you drive, and deductibles and policy limits.
If you have some driving violations or you caused an accident, you could be paying at least $1,600 to $2,200 extra each year, depending on your age. A high-risk auto insurance policy can be around 43% to 131% more than the average rate. View High Risk Driver Rates
Older drivers with a clean driving record and higher comprehensive and collision deductibles may only pay around $1,300 a year for full coverage. Prices are highest for teenage drivers, since even teens with perfect driving records can expect to pay as much as $5,100 a year. View Rates by Age
The state you live in has a huge impact on Ford Flex insurance rates. A driver around age 40 might see prices as low as $900 a year in states like Idaho, Maine, and Iowa, or at least $1,950 on average in Michigan, Louisiana, and New York.
| State | Premium | Compared to U.S. Avg | Percent Difference |
|---|---|---|---|
| Alabama | $1,234 | -$132 | -9.7% |
| Alaska | $1,048 | -$318 | -23.3% |
| Arizona | $1,134 | -$232 | -17.0% |
| Arkansas | $1,366 | -$0 | 0.0% |
| California | $1,554 | $188 | 13.8% |
| Colorado | $1,302 | -$64 | -4.7% |
| Connecticut | $1,404 | $38 | 2.8% |
| Delaware | $1,544 | $178 | 13.0% |
| Florida | $1,708 | $342 | 25.0% |
| Georgia | $1,260 | -$106 | -7.8% |
| Hawaii | $980 | -$386 | -28.3% |
| Idaho | $924 | -$442 | -32.4% |
| Illinois | $1,018 | -$348 | -25.5% |
| Indiana | $1,028 | -$338 | -24.7% |
| Iowa | $920 | -$446 | -32.7% |
| Kansas | $1,296 | -$70 | -5.1% |
| Kentucky | $1,862 | $496 | 36.3% |
| Louisiana | $2,020 | $654 | 47.9% |
| Maine | $842 | -$524 | -38.4% |
| Maryland | $1,126 | -$240 | -17.6% |
| Massachusetts | $1,092 | -$274 | -20.1% |
| Michigan | $2,372 | $1,006 | 73.6% |
| Minnesota | $1,144 | -$222 | -16.3% |
| Mississippi | $1,634 | $268 | 19.6% |
| Missouri | $1,212 | -$154 | -11.3% |
| Montana | $1,466 | $100 | 7.3% |
| Nebraska | $1,078 | -$288 | -21.1% |
| Nevada | $1,638 | $272 | 19.9% |
| New Hampshire | $984 | -$382 | -28.0% |
| New Jersey | $1,526 | $160 | 11.7% |
| New Mexico | $1,210 | -$156 | -11.4% |
| New York | $1,438 | $72 | 5.3% |
| North Carolina | $786 | -$580 | -42.5% |
| North Dakota | $1,118 | -$248 | -18.2% |
| Ohio | $944 | -$422 | -30.9% |
| Oklahoma | $1,400 | $34 | 2.5% |
| Oregon | $1,250 | -$116 | -8.5% |
| Pennsylvania | $1,302 | -$64 | -4.7% |
| Rhode Island | $1,820 | $454 | 33.2% |
| South Carolina | $1,236 | -$130 | -9.5% |
| South Dakota | $1,152 | -$214 | -15.7% |
| Tennessee | $1,196 | -$170 | -12.4% |
| Texas | $1,646 | $280 | 20.5% |
| Utah | $1,010 | -$356 | -26.1% |
| Vermont | $934 | -$432 | -31.6% |
| Virginia | $816 | -$550 | -40.3% |
| Washington | $1,056 | -$310 | -22.7% |
| West Virginia | $1,250 | -$116 | -8.5% |
| Wisconsin | $944 | -$422 | -30.9% |
| Wyoming | $1,216 | -$150 | -11.0% |
Opting for high physical damage deductibles could cut prices by as much as $510 a year, while buying higher liability limits will increase prices. Going from a 50/100 bodily injury protection limit to a 250/500 limit will increase prices by as much as $407 more per year. View Rates by Deductible or Liability Limit
Since prices can be so different, the only way to know your exact price is to get quotes and see how they stack up. Each insurance company utilizes a different rate formula, so the prices may be quite different.
Insurance Rates by Trim Level and Model Year
| Model and Trim | Annual Premium | Monthly Premium |
|---|---|---|
| Ford Flex SE 2WD | $1,294 | $108 |
| Ford Flex SEL 2WD | $1,330 | $111 |
| Ford Flex SEL AWD | $1,366 | $114 |
| Ford Flex Limited 2WD | $1,402 | $117 |
| Ford Flex Limited AWD | $1,402 | $117 |
Rates assume 2018 model year, a 40-year-old male driver with no accidents or violations, $500 comprehensive and collision deductibles, minimum liability limits, and uninsured/under-insured motorist coverage included. Rates are for comparison only and are averaged for all 50 U.S. states.
| Model Year | Comprehensive | Collision | Liability | Total Premium |
|---|---|---|---|---|
| 2018 Ford Flex | $282 | $474 | $452 | $1,366 |
| 2012 Ford Flex | $210 | $300 | $474 | $1,142 |
| 2011 Ford Flex | $206 | $272 | $478 | $1,114 |
Rates are averaged for all Ford Flex models and trim levels. Rates assume a 40-year-old male driver, full coverage with $500 deductibles, and a clean driving record.
How to Find Cheaper Ford Flex Insurance
Getting lower rates on auto insurance requires not taking risks behind the wheel, having above-average credit, eliminating unnecessary coverage, and insuring your home and auto with the same company. Comparison shop every couple of years by getting rate quotes from direct carriers, and also from several local insurance agents.
The following is a condensed summary of the material that was raised in the charts and tables above.
- Consumers who may need higher liability limits will pay around $500 each year to increase from a low limit to the 250/500 level
- Teens pay higher prices, with premiums as much as $430 a month if full coverage is included
- Drivers with multiple at-fault accidents pay on average $1,590 more every year for Flex insurance
- Increasing physical damage deductibles can save approximately $500 each year
Comparing rates is the best way to save on Ford Flex insurance rates, whether you are shopping for 2020 or 2013 Ford Flex costs. Use our free rate comparison tool below to find the best Ford Flex insurance rates in your area.
Free Car Insurance Comparison
Compare Quotes From Top Companies and Save
![]() Secured with SHA-256 Encryption
Secured with SHA-256 Encryption
What are the safety ratings of the Ford Flex?
Is the Ford Flex a reliable car? If the Ford Flex safety ratings and features are good, insurers will usually offer you cheaper rates. Some of the standard safety features in the Ford Flex include a rearview camera, rear parking sensors, and MyKey (sets speed and audio volume limits).
The Insurance Institute for Highway Safety (IIHS) has rated the Ford Flex in multiple crash tests, which you can see below.
- Small overlap front (driver-side): Acceptable
- Moderate overlap front: Good
- Side: Good
- Roof strength: Good
- Head restraints and seats: Good
View the video below for an example of the IIHS’s crash testing on the Ford Flex.
Ford Flex Compared Against Other Vehicles in the Same Class
The Ford Flex is a midsize SUV. According to the IIHS, the Ford Flex has average liability insurance losses in comparison to other midsize SUVs. This means the Ford Flex’s liability rates will be normal for its class.
Take a look at the midsize SUVs below to see how their rates compare to the Ford Flex’s rates.
Ready to start saving on insurance rates for your Ford Flex today? Enter your ZIP code in our free tool.
References
Rate Tables and Charts
Rates by Driver Age
| Driver Age | Premium |
|---|---|
| 16 | $5,160 |
| 20 | $3,140 |
| 30 | $1,416 |
| 40 | $1,366 |
| 50 | $1,246 |
| 60 | $1,222 |
Full coverage, $500 deductibles
Rates by Deductible
| Deductible | Premium |
|---|---|
| $100 | $1,698 |
| $250 | $1,544 |
| $500 | $1,366 |
| $1,000 | $1,194 |
Full coverage, driver age 40
Rates by Liability Limit
| Liability Limit | Premium |
|---|---|
| 30/60 | $1,366 |
| 50/100 | $1,492 |
| 100/300 | $1,605 |
| 250/500 | $1,899 |
| 100 CSL | $1,538 |
| 300 CSL | $1,786 |
| 500 CSL | $1,967 |
Full coverage, driver age 40
Rates for High Risk Drivers
| Age | Premium |
|---|---|
| 16 | $7,350 |
| 20 | $5,000 |
| 30 | $3,008 |
| 40 | $2,952 |
| 50 | $2,818 |
| 60 | $2,792 |
Full coverage, $500 deductibles, two speeding tickets, and one at-fault accident
If a financial responsibility filing is required, the additional charge below may also apply.
Potential Rate Discounts
If you qualify for discounts, you may save the amounts shown below.
| Discount | Savings |
|---|---|
| Multi-policy | $72 |
| Multi-vehicle | $72 |
| Homeowner | $21 |
| 5-yr Accident Free | $97 |
| 5-yr Claim Free | $88 |
| Paid in Full/EFT | $60 |
| Advance Quote | $66 |
| Online Quote | $97 |
| Total Discounts | $573 |
Discounts are estimated and may not be available from every company or in every state.
Compare Rates and Save
Find companies with the cheapest rates in your area

