
Candlestick stock price chart
Image Description
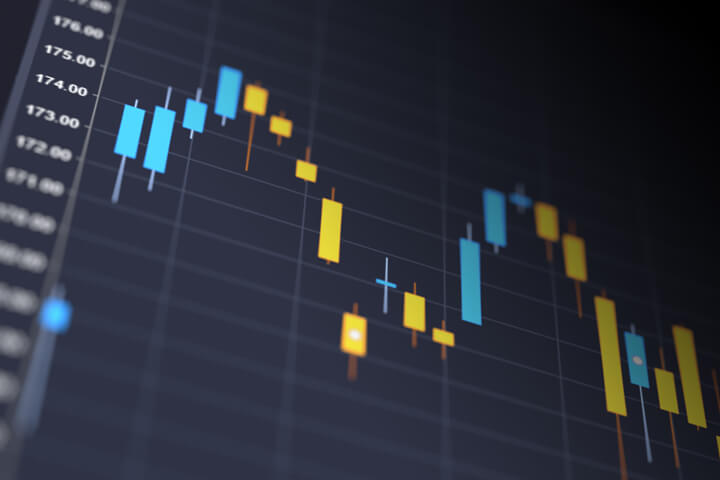
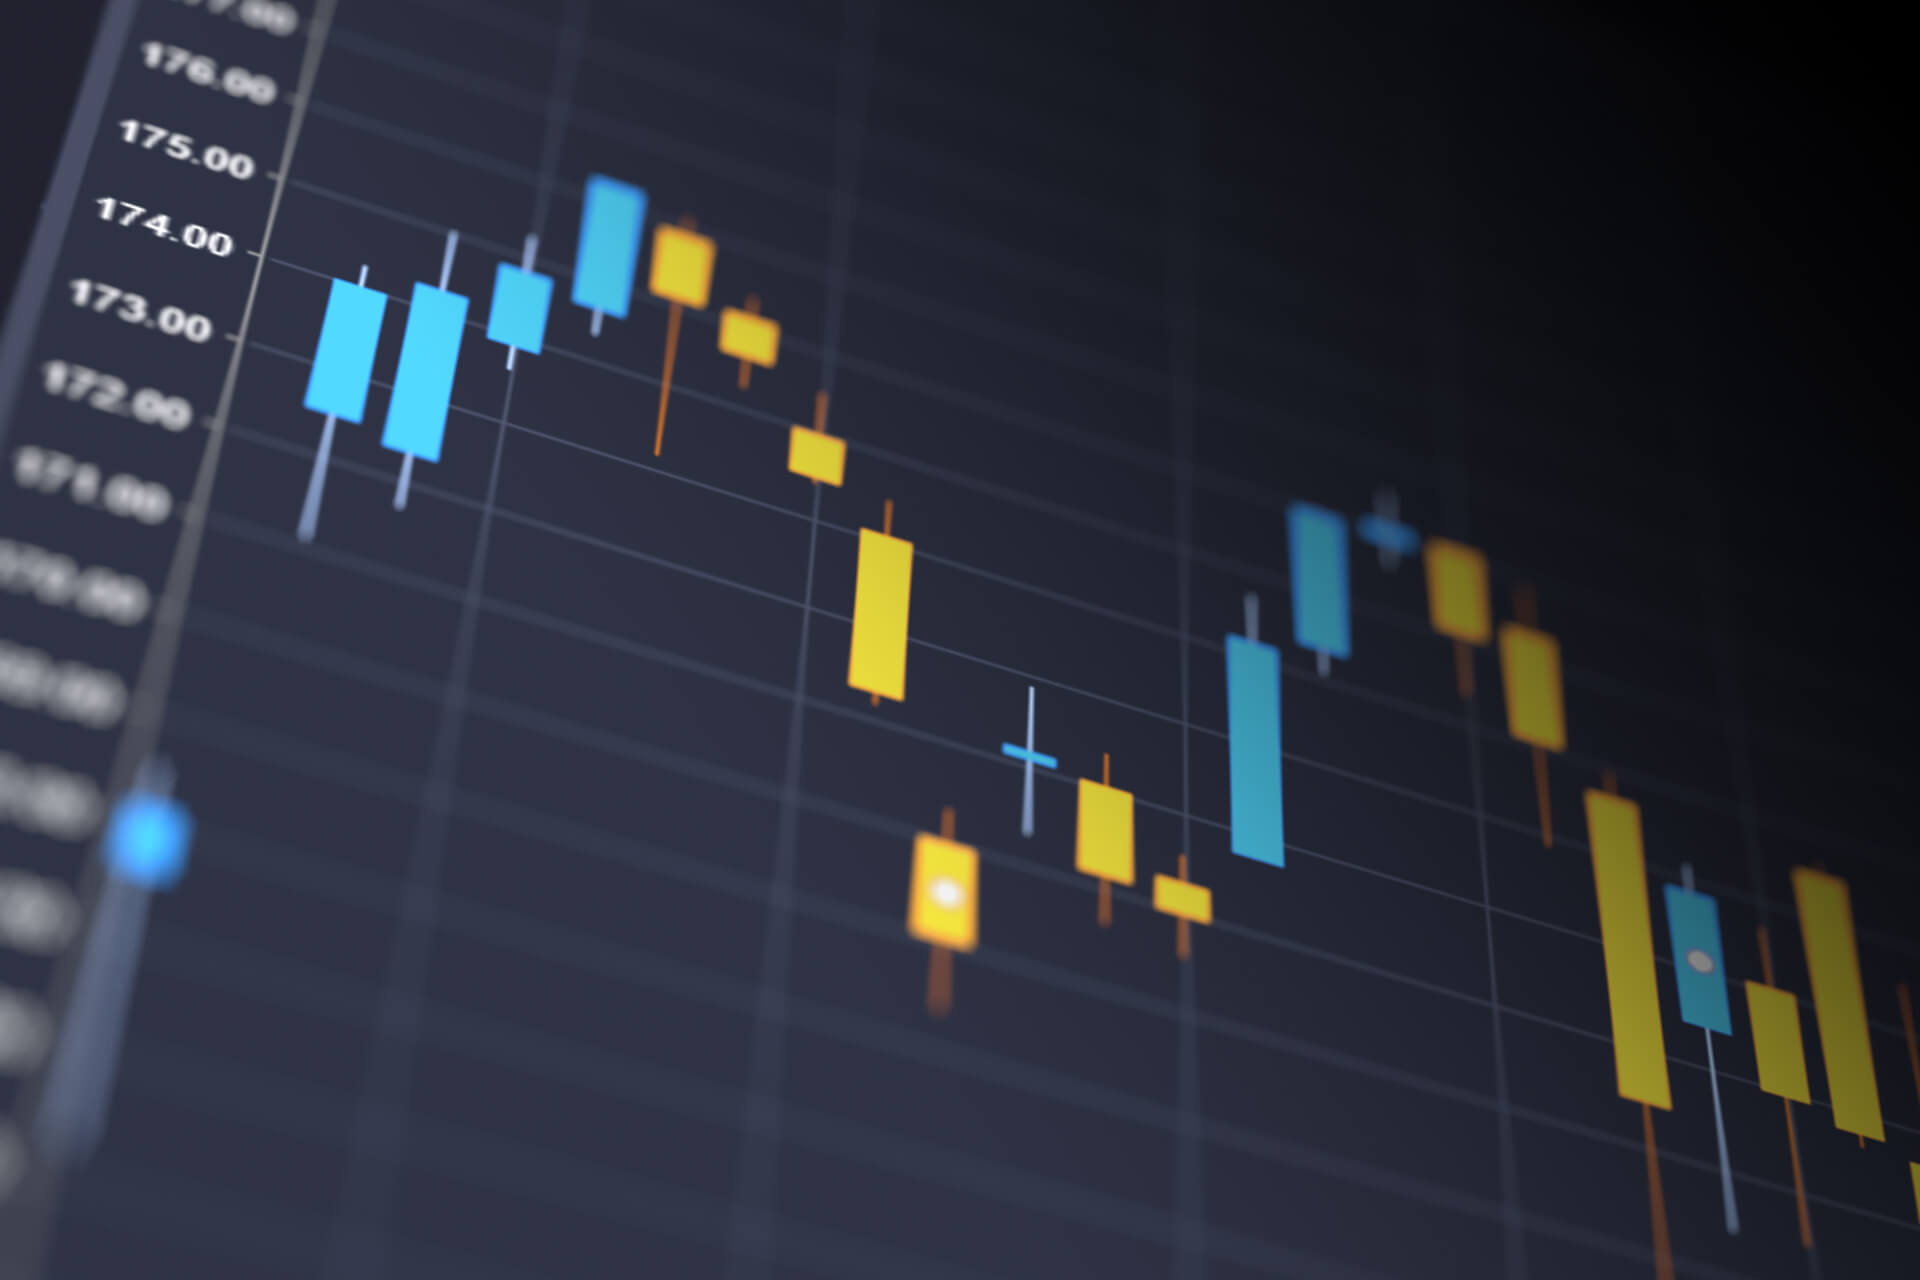
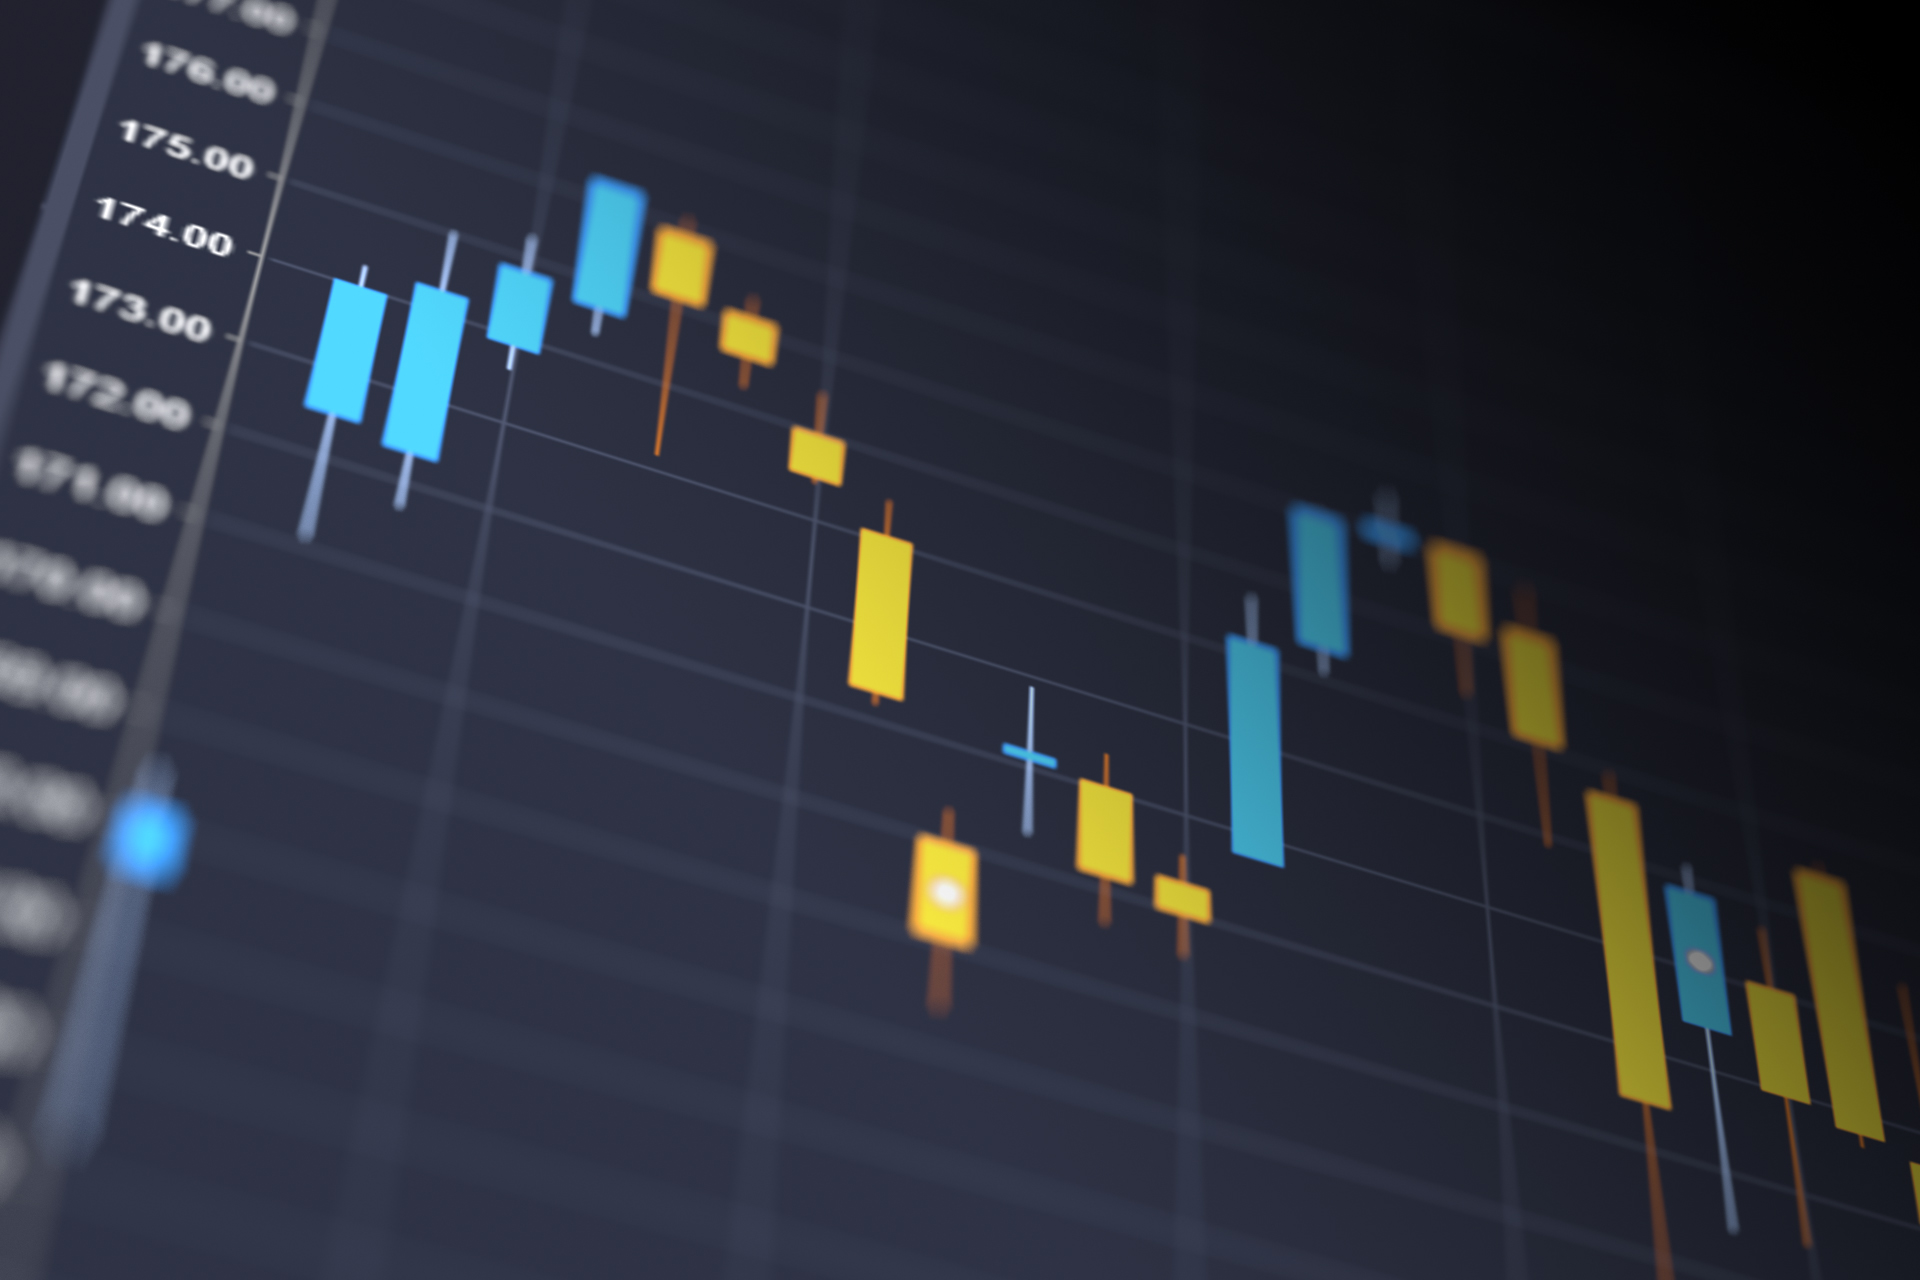
Blue and yellow candlestick chart showing stock price volatility
Download Options
720 x 480 px Optimized | 27 KB JPG
1920 x 1280 px Optimized | 75 KB JPG
1920 x 1280 px Original | 591 KB JPG
Image License

Free for personal useCommercial use allowedAttribution is required with link to QuoteInspector.com
Images similar to 'Candlestick stock price chart'

Orange dart hits colorful target with green background

Table with iPad showing stock price information, investment portfolio, and cup of coffee

Closeup of candlestick stock price chart with lens flare and overlay

Computer screenshots of area and candlestick charts for stock prices reflected

Computer screen showing stock prices with price range and fluctuation

Stock price area chart compared to other overall market price levels

Stylized screenshots of stock price area and candlestick charts

Perspective view of stock ticker with overlay of stock price area chart
Keywords for this image
candlestick price stock stock market photos volatility yellow blue chart investing images
Clicking keywords will search within the current stock market and investing category only. If you want to search all image categories, please visit the free image search page.


