Stock market and investing images containing "price"

Showing 63 free photos tagged with price

Image Search

Computer screen showing stock price candlesticks with other market price indicators

Computer screen showing stock price candlesticks with other market price indicators

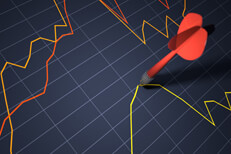
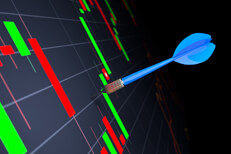
Dart at peak of market price line chart concept for selling at best price

Dart at peak of market price line chart concept for selling at best price

Shiny gold metallic piggy bank on stock price area chart with glossy surface reflection

Shiny gold metallic piggy bank on stock price area chart with glossy surface reflection

Stock area chart and candlestick chart with overlay and lens flare effects

Stock area chart and candlestick chart with overlay and lens flare effects

Shiny gold metallic piggy bank on stock and market price line chart with glossy reflection

Shiny gold metallic piggy bank on stock and market price line chart with glossy reflection

3D colorful pie chart on screenshot of stock price area chart

3D colorful pie chart on screenshot of stock price area chart

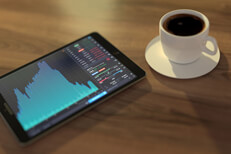
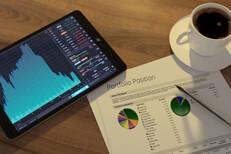
Table with iPad showing stock price information, investment portfolio, and cup of coffee

Table with iPad showing stock price information, investment portfolio, and cup of coffee

Stock price chart on dark background with red dart randomly stuck into the chart

Stock price chart on dark background with red dart randomly stuck into the chart

Large roll of U.S. bills laying on top of line charts showing massive stock price fluctuation

Large roll of U.S. bills laying on top of line charts showing massive stock price fluctuation

Red dice on stock ticker chart showing stock prices and buy/sell recommendations

Red dice on stock ticker chart showing stock prices and buy/sell recommendations

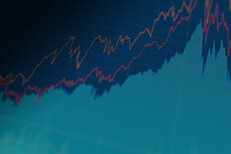
Area chart showing stock price increase and volume

Area chart showing stock price increase and volume

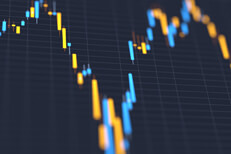
Blue and yellow candlestick chart showing stock price volatility

Blue and yellow candlestick chart showing stock price volatility

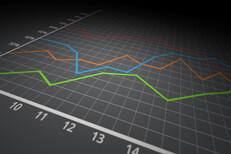
Colorful line chart showing price increase and decrease over time

Colorful line chart showing price increase and decrease over time

Close up view of rolls of money next to bright stock price candlestick chart

Close up view of rolls of money next to bright stock price candlestick chart

Two rolls of U.S. currency on screenshot of stock price area chart

Two rolls of U.S. currency on screenshot of stock price area chart

Money rolls sitting on stock price line charts

Money rolls sitting on stock price line charts

Dart sticking out of stock price area chart concept

Dart sticking out of stock price area chart concept

Sell keyboard key on stock price candlestick chart representing stock sale

Sell keyboard key on stock price candlestick chart representing stock sale

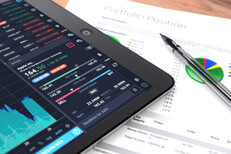
Paper on table showing portfolio position and tablet with stock price information

Paper on table showing portfolio position and tablet with stock price information

Stock price chart with dart thrown randomly

Stock price chart with dart thrown randomly

Stock price area chart showing steep climb and subsequent fall

Stock price area chart showing steep climb and subsequent fall

Stock price charts showing volatility of stock prices over time

Stock price charts showing volatility of stock prices over time

Buy key from laptop on top of stock candlestick chart showing stock price ranges by day

Buy key from laptop on top of stock candlestick chart showing stock price ranges by day

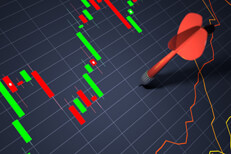
Dart sticking out of screenshot of stock price candlestick chart

Dart sticking out of screenshot of stock price candlestick chart

Stock price area chart with other market indicators overlaid as line charts

Stock price area chart with other market indicators overlaid as line charts

Computer monitor showing various stock price charts

Computer monitor showing various stock price charts

Computer screenshots of area and candlestick charts for stock prices reflected

Computer screenshots of area and candlestick charts for stock prices reflected

Line chart on dark background showing investment price increase over time

Line chart on dark background showing investment price increase over time

Screen showing stock price area chart compared to overall market return line charts

Screen showing stock price area chart compared to overall market return line charts

Screenshot of stock price area chart and market indicator line charts

Screenshot of stock price area chart and market indicator line charts

Scrabble-like wood letters spelling STOCKS laying on stock price area chart

Scrabble-like wood letters spelling STOCKS laying on stock price area chart

Two rolls of U.S. bills laying on top of bright green stock price area chart

Two rolls of U.S. bills laying on top of bright green stock price area chart

Rolls of U.S. currency on computer screen with stock price area chart

Rolls of U.S. currency on computer screen with stock price area chart

Line and candlestick charts showing stock prices with lens flare and overlay

Line and candlestick charts showing stock prices with lens flare and overlay

Laptop with stock price screen on table with glasses and coffee cup with lighting flare effect

Laptop with stock price screen on table with glasses and coffee cup with lighting flare effect

Computer screen showing stock prices with price range and fluctuation

Computer screen showing stock prices with price range and fluctuation

Stock price area chart reflecting into glossy surface showing stock price candlestick chart

Stock price area chart reflecting into glossy surface showing stock price candlestick chart

Computer screen showing individual stock price variation compared to other indicators

Computer screen showing individual stock price variation compared to other indicators

Computer screens showing stock price area chart, trading volume, and candlestick price changes

Computer screens showing stock price area chart, trading volume, and candlestick price changes

Stock price chart with shallow depth-of-field

Stock price chart with shallow depth-of-field

Laptop showing stock prices and area chart with coffee cup in background

Laptop showing stock prices and area chart with coffee cup in background

alt

alt

Stylized screenshots of stock price area and candlestick charts

Stylized screenshots of stock price area and candlestick charts

Screen showing stock price area chart and price candlestick chart

Screen showing stock price area chart and price candlestick chart

Closeup of candlestick stock price chart with lens flare and overlay

Closeup of candlestick stock price chart with lens flare and overlay

3D pie chart sitting on stock price area chart representing stocks as part of asset allocation

3D pie chart sitting on stock price area chart representing stocks as part of asset allocation

Screenshot of stock area chart and market indicators with dart sticking out

Screenshot of stock area chart and market indicators with dart sticking out

Perspective view of stock ticker with overlay of stock price area chart

Perspective view of stock ticker with overlay of stock price area chart

Stock price area chart and trading volume reflected in glossy candlestick chart

Stock price area chart and trading volume reflected in glossy candlestick chart

Computer screen showing stock data including price area chart, stock listings, and market capitalization

Computer screen showing stock data including price area chart, stock listings, and market capitalization

Stock price ticker with sell recommendation and down arrow

Stock price ticker with sell recommendation and down arrow

Two bundles of U.S. paper bills on stock price line chart and candlestick chart

Two bundles of U.S. paper bills on stock price line chart and candlestick chart

Shiny gold piggy bank on stock price charts representing investments

Shiny gold piggy bank on stock price charts representing investments

Stock ticker with stock prices, percentage change, buy and sell recommendations, and market capitalization

Stock ticker with stock prices, percentage change, buy and sell recommendations, and market capitalization

Shallow depth of field view of stock price area chart and candlestick chart

Shallow depth of field view of stock price area chart and candlestick chart

Stock price area chart compared to other overall market price levels

Stock price area chart compared to other overall market price levels

Laptop with stock price information showing on table with coffee and reading glasses

Laptop with stock price information showing on table with coffee and reading glasses

Stock ticker screen showing price, percent change, and buy sell recommendations

Stock ticker screen showing price, percent change, and buy sell recommendations

Concept of speculation risk showing red dice on candlestick and line charts for stock and market prices

Concept of speculation risk showing red dice on candlestick and line charts for stock and market prices

Laptop on table with sunrise showing stock prices and area chart

Laptop on table with sunrise showing stock prices and area chart

Laptop on table with coffee mug showing stock price information and area chart

Laptop on table with coffee mug showing stock price information and area chart

Laptop on table at sunrise showing stock price information

Laptop on table at sunrise showing stock price information

White paper showing stock price volatility and dart stuck representing poor investment strategy

White paper showing stock price volatility and dart stuck representing poor investment strategy

Keywords for these images

3d allocation area arrow asset bank best bills blue blurred bright bundled bundles buy candlestick candlesticks capitalization chart charts closeup coffee colorful computer concept cup currency dark dart data depth-of-field dice down flare fluctuation glasses glossy gold green increase indicator indicators individual investment investments ipad key keyboard laptop letters levels lighting listings market markets metallic money monitor morning mug paper peak pen percent percentage perspective pick picking picks pie piggy poor portfolio price prices range ranges recommendation recommendations red reflected reflecting reflection research return risk sale screen screens screenshot screenshots sell selling shiny speculation steep stock stocks strategy stylized sunrise table tablet ticker time trading u.s. variation volatility volume white wood yellow

Clicking keywords will search within the current stock market and investing category only. If you want to search all image galleries at once, please visit the image search page.

Scroll to top