
Jaguar XE Insurance Rates
Enter your zip code below to view companies that have cheap auto insurance rates.
Michelle Robbins
Licensed Insurance Agent
Michelle Robbins has been a licensed insurance agent for over 13 years. Her career began in the real estate industry, supporting local realtors with Title Insurance. After several years, Michelle shifted to real estate home warranty insurance, where she managed a territory of over 100 miles of real estate professionals. Later, Agent Robbins obtained more licensing and experience serving families a...
Licensed Insurance Agent
UPDATED: Apr 29, 2024
It’s all about you. We want to help you make the right coverage choices.
Advertiser Disclosure: We strive to help you make confident car insurance decisions. Comparison shopping should be easy. We are not affiliated with any one car insurance provider and cannot guarantee quotes from any single provider.
Our insurance industry partnerships don’t influence our content. Our opinions are our own. To compare quotes from many different companies please enter your ZIP code on this page to use the free quote tool. The more quotes you compare, the more chances to save.
Editorial Guidelines: We are a free online resource for anyone interested in learning more about auto insurance. Our goal is to be an objective, third-party resource for everything auto insurance related. We update our site regularly, and all content is reviewed by auto insurance experts.
The average insurance prices for a Jaguar XE are $1,464 every 12 months including full coverage. Comprehensive costs on average $298 each year, collision insurance costs $548, and liability insurance is $460. Liability-only insurance costs around $510 a year, and high-risk driver insurance costs around $3,178. 16-year-old drivers cost the most to insure at up to $5,512 a year.
Average premium for full coverage: $1,464
Policy rates by type of insurance:
Prices are based on $500 policy deductibles, split liability limits of 30/60, and includes uninsured motorist and medical coverage. Prices are averaged for all 50 U.S. states and XE models.
Price Range Variability
For an average driver, Jaguar XE insurance rates range from the cheapest price of $510 for the bare minimum liability coverage to a high rate of $3,178 for coverage for higher-risk drivers.
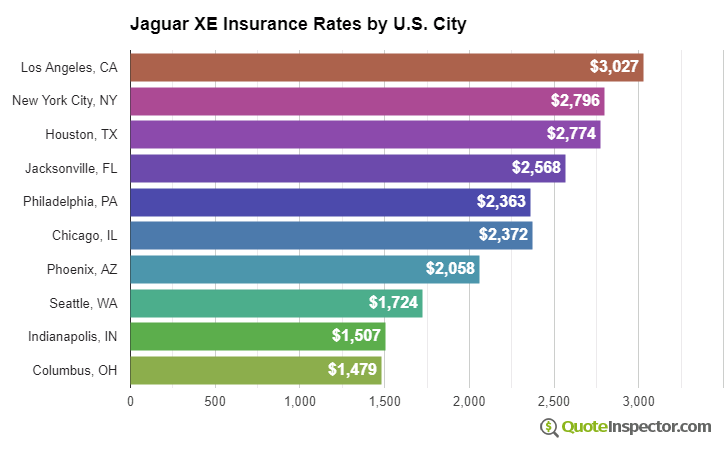
Urban vs. Rural Price Range
Choosing to live in a large city has a significant impact on car insurance rates. Rural areas are shown to have more infrequent comprehensive and collision claims than congested cities. The graphic below illustrates the effect of geographic area on car insurance rates.
The examples above highlight why all drivers should compare rates quotes based on a specific location and their own driving history, rather than relying on rate averages.
Use the form below to get customized rates for your location.
Enter your zip code below to view companies based on your location that have cheap auto insurance rates.
Additional Rate Information
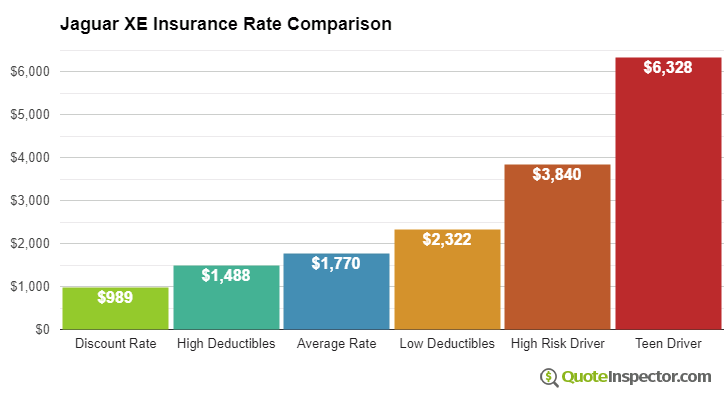
The chart below breaks down average Jaguar XE insurance rates for different risk profiles and scenarios.
- The best full coverage rate is $838
- Raising to $1,000 deductibles will save around $192 every year
- The average price for a good driver age 40 with $500 deductibles is $1,464
- Buying low deductibles increases the price to $1,836
- Higher-risk drivers with multiple tickets or accidents could pay upwards of $3,178
- Policy cost to insure a teen driver may cost $5,512
Auto insurance rates for a Jaguar XE also range considerably based on liability limits and deductibles, your driving characteristics, and the trim level of your XE.
Opting for high physical damage deductibles can reduce rates by up to $570 each year, whereas increasing liability limits will cost you more. Changing from a 50/100 liability limit to a 250/500 limit will raise rates by up to $414 extra every year. View Rates by Deductible or Liability Limit
More mature drivers with a good driving record and higher deductibles could pay as little as $1,400 every 12 months on average, or $117 per month, for full coverage. Rates are highest for teenagers, since even excellent drivers will have to pay upwards of $5,500 a year. View Rates by Age
If you have a few points on your driving record or you were responsible for an accident, you are likely paying at a minimum $1,700 to $2,400 in extra premium every year, depending on your age. Insurance for high-risk drivers is expensive and can cost anywhere from 44% to 130% more than the average rate. View High Risk Driver Rates
Your home state also has a big influence on Jaguar XE insurance rates. A middle-age driver might find rates as low as $1,120 a year in states like Missouri, New Hampshire, and Vermont, or at least $2,090 on average in Michigan, New York, and Louisiana.
| State | Premium | Compared to U.S. Avg | Percent Difference |
|---|---|---|---|
| Alabama | $1,324 | -$140 | -9.6% |
| Alaska | $1,122 | -$342 | -23.4% |
| Arizona | $1,216 | -$248 | -16.9% |
| Arkansas | $1,464 | -$0 | 0.0% |
| California | $1,668 | $204 | 13.9% |
| Colorado | $1,398 | -$66 | -4.5% |
| Connecticut | $1,504 | $40 | 2.7% |
| Delaware | $1,656 | $192 | 13.1% |
| Florida | $1,830 | $366 | 25.0% |
| Georgia | $1,350 | -$114 | -7.8% |
| Hawaii | $1,052 | -$412 | -28.1% |
| Idaho | $992 | -$472 | -32.2% |
| Illinois | $1,090 | -$374 | -25.5% |
| Indiana | $1,100 | -$364 | -24.9% |
| Iowa | $988 | -$476 | -32.5% |
| Kansas | $1,390 | -$74 | -5.1% |
| Kentucky | $1,998 | $534 | 36.5% |
| Louisiana | $2,164 | $700 | 47.8% |
| Maine | $904 | -$560 | -38.3% |
| Maryland | $1,208 | -$256 | -17.5% |
| Massachusetts | $1,172 | -$292 | -19.9% |
| Michigan | $2,544 | $1,080 | 73.8% |
| Minnesota | $1,226 | -$238 | -16.3% |
| Mississippi | $1,752 | $288 | 19.7% |
| Missouri | $1,298 | -$166 | -11.3% |
| Montana | $1,572 | $108 | 7.4% |
| Nebraska | $1,154 | -$310 | -21.2% |
| Nevada | $1,754 | $290 | 19.8% |
| New Hampshire | $1,054 | -$410 | -28.0% |
| New Jersey | $1,636 | $172 | 11.7% |
| New Mexico | $1,298 | -$166 | -11.3% |
| New York | $1,542 | $78 | 5.3% |
| North Carolina | $844 | -$620 | -42.3% |
| North Dakota | $1,198 | -$266 | -18.2% |
| Ohio | $1,012 | -$452 | -30.9% |
| Oklahoma | $1,504 | $40 | 2.7% |
| Oregon | $1,340 | -$124 | -8.5% |
| Pennsylvania | $1,396 | -$68 | -4.6% |
| Rhode Island | $1,954 | $490 | 33.5% |
| South Carolina | $1,326 | -$138 | -9.4% |
| South Dakota | $1,236 | -$228 | -15.6% |
| Tennessee | $1,282 | -$182 | -12.4% |
| Texas | $1,764 | $300 | 20.5% |
| Utah | $1,084 | -$380 | -26.0% |
| Vermont | $1,002 | -$462 | -31.6% |
| Virginia | $876 | -$588 | -40.2% |
| Washington | $1,132 | -$332 | -22.7% |
| West Virginia | $1,340 | -$124 | -8.5% |
| Wisconsin | $1,014 | -$450 | -30.7% |
| Wyoming | $1,306 | -$158 | -10.8% |
| Model Year | Comprehensive | Collision | Liability | Total Premium |
|---|---|---|---|---|
| 2024 Jaguar XE | $382 | $774 | $398 | $1,712 |
| 2023 Jaguar XE | $368 | $756 | $416 | $1,698 |
| 2022 Jaguar XE | $356 | $724 | $430 | $1,668 |
| 2021 Jaguar XE | $336 | $698 | $442 | $1,634 |
| 2020 Jaguar XE | $324 | $648 | $452 | $1,582 |
| 2019 Jaguar XE | $310 | $610 | $456 | $1,534 |
| 2018 Jaguar XE | $298 | $548 | $460 | $1,464 |
| 2017 Jaguar XE | $278 | $504 | $460 | $1,400 |
Rates are averaged for all Jaguar XE models and trim levels. Rates assume a 40-year-old male driver, full coverage with $500 deductibles, and a clean driving record.
How to Shop for Affordable Jaguar XE Insurance
Finding cheaper rates on Jaguar XE insurance consists of being safe and accident-free, having a good credit score, paying for small claims out-of-pocket, and deciding if full coverage is necessary. Take the time to compare rates at least once a year by requesting rates from direct car insurance companies, and also from your local independent and exclusive agents.
Below you'll find a brief review of the primary concepts that were covered in the above illustrations.
- You may be able to save as much as $180 per year just by quoting online in advance
- High-risk drivers with DUI or reckless driving convictions may pay on average $1,710 more each year than a low-risk driver
- Increasing comprehensive and collision deductibles could save as much as $575 each year
- Youthful drivers are charged the highest rates, with premiums being up to $459 each month if comprehensive and collision insurance is included
Rate Tables and Charts
Rates by Driver Age
| Driver Age | Premium |
|---|---|
| 16 | $5,512 |
| 20 | $3,386 |
| 30 | $1,524 |
| 40 | $1,464 |
| 50 | $1,338 |
| 60 | $1,312 |
Full coverage, $500 deductibles
Rates by Deductible
| Deductible | Premium |
|---|---|
| $100 | $1,836 |
| $250 | $1,664 |
| $500 | $1,464 |
| $1,000 | $1,272 |
Full coverage, driver age 40
Rates by Liability Limit
| Liability Limit | Premium |
|---|---|
| 30/60 | $1,464 |
| 50/100 | $1,556 |
| 100/300 | $1,671 |
| 250/500 | $1,970 |
| 100 CSL | $1,602 |
| 300 CSL | $1,855 |
| 500 CSL | $2,039 |
Full coverage, driver age 40
Rates for High Risk Drivers
| Age | Premium |
|---|---|
| 16 | $7,868 |
| 20 | $5,398 |
| 30 | $3,246 |
| 40 | $3,178 |
| 50 | $3,036 |
| 60 | $3,010 |
Full coverage, $500 deductibles, two speeding tickets, and one at-fault accident
If a financial responsibility filing is required, the additional charge below may also apply.
Potential Rate Discounts
If you qualify for discounts, you may save the amounts shown below.
| Discount | Savings |
|---|---|
| Multi-policy | $78 |
| Multi-vehicle | $78 |
| Homeowner | $22 |
| 5-yr Accident Free | $108 |
| 5-yr Claim Free | $96 |
| Paid in Full/EFT | $67 |
| Advance Quote | $73 |
| Online Quote | $104 |
| Total Discounts | $626 |
Discounts are estimated and may not be available from every company or in every state.
Compare Rates and Save
Find companies with the cheapest rates in your area


