
Basic Attention Token (BAT) price chart
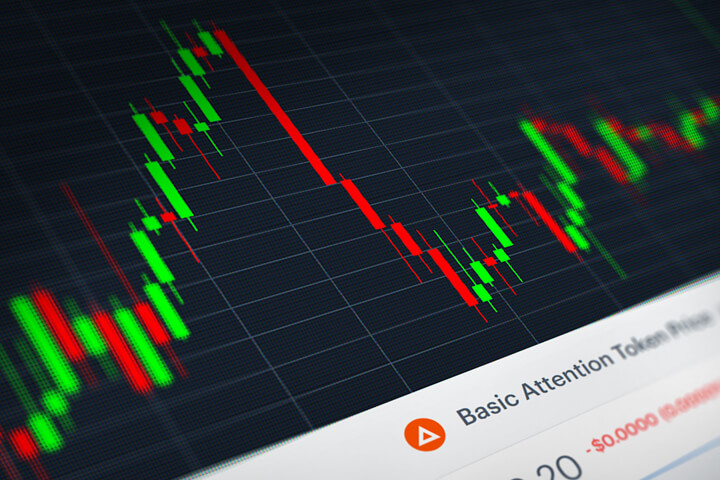
Image Description
Basic Attention Token (BAT) stock price candlestick chart monitor screenshot showing volatility and price increases and declines
Download Options
720 x 480 px Optimized | 139 KB JPG
1920 x 1280 px Optimized | 407 KB JPG
1920 x 1280 px Original | 1,833 KB JPG
Image License

Free for personal useCommercial use allowedAttribution is required with link to QuoteInspector.com
Images similar to 'Basic Attention Token (BAT) price chart'
 cryptocurrency stock price chart")
Stellar (XLM) stock price candlestick chart monitor screenshot showing volatility and price increases and declines

Area chart showing Bitcoin price decline over time with single Bitcoin in corner of chart

Stock ticker chart showing cryptocurrency prices with Litecoin price increase highlighted
 cryptocurrency stock price chart")
Ethereum (ETH) stock price candlestick chart monitor screenshot showing volatility and price increases and declines
 cryptocurrency stock price chart")
Monero (XMR) stock price candlestick chart monitor screenshot showing volatility and price increases and declines

Area chart showing BTCUSD stock price rise and fall with large Bitcoin in corner
 price chart")
Bitcoin (BTC) stock price candlestick chart monitor screenshot showing volatility and price increases and declines

Stock ticker chart showing cryptocurrency prices with Litecoin price decrease highlighted
Keywords for this image
stock volatility candlestick chart attention token increases monitor screenshot bat declines price basic
Clicking keywords will search within the current bitcoin and cryptocurrency category only. If you want to search all image categories, please visit the free image search page.


