Bitcoin and cryptocurrency images containing "volatility"

Showing 25 free photos tagged with volatility
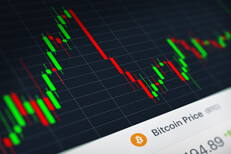
Image Search

Bitcoin (BTC) stock price candlestick chart monitor screenshot showing volatility and price increases and declines
Bitcoin (BTC) stock price candlestick chart monitor screenshot showing volatility and price increases and declines
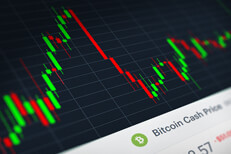
Bitcoin Cash (BCH) stock price candlestick chart monitor screenshot showing volatility and price increases and declines
Bitcoin Cash (BCH) stock price candlestick chart monitor screenshot showing volatility and price increases and declines
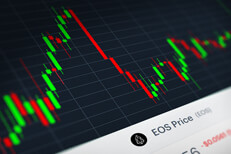
EOS crytocurrency stock price candlestick chart monitor screenshot showing volatility and price increases and declines
EOS crytocurrency stock price candlestick chart monitor screenshot showing volatility and price increases and declines

Ripple (XRP) stock price candlestick chart monitor screenshot showing volatility and price increases and declines
Ripple (XRP) stock price candlestick chart monitor screenshot showing volatility and price increases and declines
Ethereum (ETH) stock price candlestick chart monitor screenshot showing volatility and price increases and declines

Ethereum (ETH) stock price candlestick chart monitor screenshot showing volatility and price increases and declines

Basic Attention Token (BAT) stock price candlestick chart monitor screenshot showing volatility and price increases and declines

Basic Attention Token (BAT) stock price candlestick chart monitor screenshot showing volatility and price increases and declines

Monero (XMR) stock price candlestick chart monitor screenshot showing volatility and price increases and declines

Monero (XMR) stock price candlestick chart monitor screenshot showing volatility and price increases and declines

Tron (TRX) stock price candlestick chart monitor screenshot showing volatility and price increases and declines

Tron (TRX) stock price candlestick chart monitor screenshot showing volatility and price increases and declines

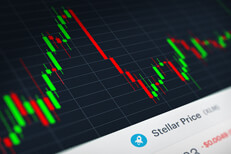
Stellar (XLM) stock price candlestick chart monitor screenshot showing volatility and price increases and declines

Stellar (XLM) stock price candlestick chart monitor screenshot showing volatility and price increases and declines

Bitcoin on iPhone showing stock trading app screen with volatility and volume

Bitcoin on iPhone showing stock trading app screen with volatility and volume

Ripple XRP and Bitcoin on mobile app showing trading volatility and volume

Ripple XRP and Bitcoin on mobile app showing trading volatility and volume

Stack of Bitcoins next to iPhone showing stock trades volatility and volume with Buy button

Stack of Bitcoins next to iPhone showing stock trades volatility and volume with Buy button

Bitcoin with reflection in front of monitor showing stock price and volatility

Bitcoin with reflection in front of monitor showing stock price and volatility

BTCUSD stock price candlestick chart showing steep climb and fall

BTCUSD stock price candlestick chart showing steep climb and fall

Monitor showing BTC stock price volatility with Bitcoins

Monitor showing BTC stock price volatility with Bitcoins

Bitcoin reflecting BTC stock price volatility and trading volume

Bitcoin reflecting BTC stock price volatility and trading volume

Pile of Bitcoins with blue and gold lighting representing hot and cold or Bitcoin stock price volatility

Pile of Bitcoins with blue and gold lighting representing hot and cold or Bitcoin stock price volatility

Pile of Bitcoins with gold and blue lighting representing hot and cold or Bitcoin stock price volatility

Pile of Bitcoins with gold and blue lighting representing hot and cold or Bitcoin stock price volatility

Concept of Bitcoin price drop, market volatility, or cryptocurrency market crash showing broken or cracked Bitcoin

Concept of Bitcoin price drop, market volatility, or cryptocurrency market crash showing broken or cracked Bitcoin

Small stack of Bitcoins in front of monitor showing market area chart and price volatility in blue

Small stack of Bitcoins in front of monitor showing market area chart and price volatility in blue

Small stack of Bitcoins in front of market trade monitor showing green area chart for price volatility

Small stack of Bitcoins in front of market trade monitor showing green area chart for price volatility

Broken Bitcoin concept for falling prices, cryptocurrency market crash, or price volatility

Broken Bitcoin concept for falling prices, cryptocurrency market crash, or price volatility

Small stack of Bitcoins in front of monitor showing blue area chart with cryptocurrency price fluctuations

Small stack of Bitcoins in front of monitor showing blue area chart with cryptocurrency price fluctuations

Bitcoin vertical on laptop keyboard in front of blue price volatility area chart on screen

Bitcoin vertical on laptop keyboard in front of blue price volatility area chart on screen

Stack of Bitcoins in front of trading price volatility area chart with stylized overlay and light effect

Stack of Bitcoins in front of trading price volatility area chart with stylized overlay and light effect

Keywords for these images

bat bch btc eth trx xlm xmr xrp app area attention basic bitcoin bitcoins blockchain blue broken btc btcusd button buy candlestick cash chart coins cold concept cracked crash crypto cryptocurrency crytocurrency declines eos ethereum fluctuations gold green hot increases iphone keyboard laptop light lighting market mobile monero monitor pile price prices reflecting reflection ripple screen screenshot shattered stack steep stellar stock stylized token trade trades trading tron vertical volatile volatility volume xrp

Clicking keywords will search within the current Bitcoin and cryptocurrency category only. If you want to search all image galleries at once, please visit the image search page.

Scroll to top